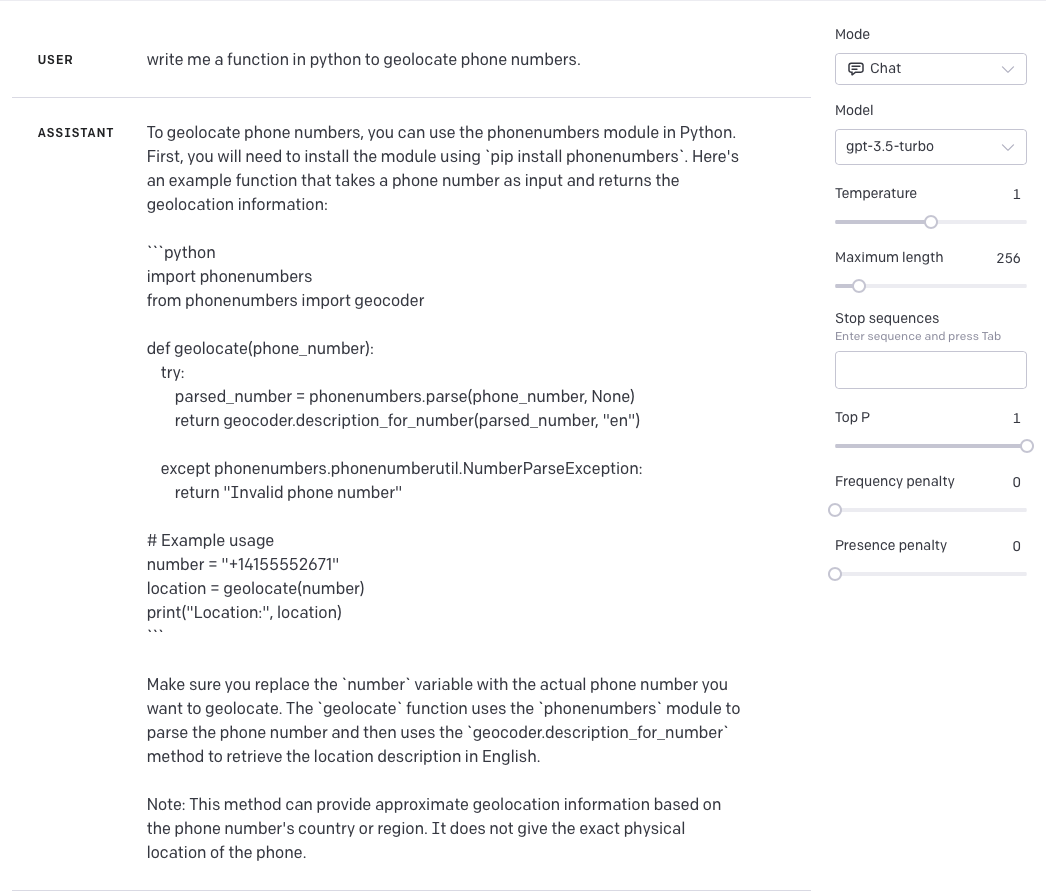
A lot of people have tried out ChatGPT and other LLMs for code their code writing abilities. My theory was that the LLMs would be really good at writing code to do things they’ve seen before, but not so good at things that were completely new. I started my experiments by asking ChatGPT to write me a function in python to geolocate a phone number. ChatGPT 3.5 did a relatively poor job of this, so I tried again using the playground and gpt-3.5-turbo. This time it was more successful.
That’s not bad. I like that it used the phonenumbers library rather than calling some external service.
ChatGPT has been all over the news for the last few months and again with the release of GPT-4. At DataDistillr, we added a query assistant using this technology which allows a user to simply ask a question and DataDistillr will generate a query that answers that question. I decided to write an article about what I’ve learned and my experiences with this. I started drafting this an about a month ago, and last Friday, there was a fairly significant development whereby OpenAI removed two of the models we were using.
Now candidly, I’ve never been a fan of natural language interfaces for data. When I was at Booz Allen, there was a project called Sailfish which attempted to do just that. As I recall, it was a natural language interface over data lakes. I’ll be charitable and say that it didn’t work very well. What I observed was that it worked well enough IF the data was clean, IF the question being asked was simple and IF the question didn’t involve multiple data sources. I think it also required a lengthy onboarding process as well. What became apparent was that if you wanted it to get you an answer you had to start writing statements that were something like this:
Show me the name, average age and average purchase amount using the customers and products table for customers that were born between 1980 and 1990.
Now, if you’re like me and looking at that, you’re already thinking:
SELECT name, avg(datediff(now(), birthday)), avg(purchase)
FROM customers
JOIN orders ON customers.id = orders.customerid
...
GROUP BY customers.id.
What I observed then was that the more complex a question you had , the more the request started to look like a weird SQL statement. At a certain point, every time I used it, I couldn’t help but think that there was really no point to this and that the user would be better served just learning SQL.
Fast forward a few years, and ChatGPT came out and it turns out that it actually does an amazingly good job of translating intent into SQL. So with that said, here are some observations I have after working with it for several months to write SQL queries.
A colleague of mine recently gave me a data challenge called the Hanukkah of Data (https://hanukkah.bluebird.sh/about/) which has 8 challenges. I decided to try them out in DataDistillr. The challenges use a fictional data set which consists of four tables: a customer table, a product table, an order table and a table linking orders to products. The data was very representative of what a customer database might look like. I did, however make some modifications to the data to facilitate querying. The address line was not split up into city, state, zip. So I imported this data into a database, and then split these fields up into separate columns.
Overall, this was a really well done challenge and my compliments to the authors.
SPOILER ALERT
If you choose to read beyond this point, it will have my answers so if you want to try it yourself, stop right here. I warned you… Really … go no further.
Happy New Year everyone! I’m pretty excited about this. Like every other tech geek out there, I was experimenting with ChatGPT when it was announced in December of 2022.
Initially I was amazed at how well the AI appeared to work, and somewhat terrified with what people could actually do with it. I teach a database class at the University of Maryland Baltimore County (UMBC) and I was really worried that students could use ChatGPT to generate answers to essay questions on my exams. I wanted to see if there were ways of phrasing questions that would make it obvious that a person did not write them. After using ChatGPT for a while, I do think it would be possible to detect if a student was using AI to write their papers, as the quality and style are fairly distinct.
But I digress…
What really intrigued me was that these models can write SQL queries using natural language. Of course the fact that you can write a SQL query isn’t necessarily useful unless you understand the schema of the underlying data and you have a query engine or database capable of executing that query.
Well… guess what…
My team and I have been hard at work at incorporating this powerful feature into our DataDistillr. Today, I am happy to announce that we’ve added natural language AI capability to DataDistillr!
Well, that day has finally come! After months of testing, speaking with customers and investors, our public beta is finally live! Almost exactly two years ago, I quit my job at JP Morgan, and launched DataDistillr and last week, we turned on our app for the world to try out. I would be honored if you tried it out. You can try it for free at https://app.datadistillr.io.
For a founder, this is really the big moment. I’ve always envisioned our product as a virtual “github” for data and this was finally the moment where vision meets reality. What will people say when they use your tool? Will all that work you spent on UI flows pay off or will people just look at your product as if it is the next Crystal Pepsi or something similar. The closest comparison I can think of is the feeling you get when you send your child out into the world.
One of the big challenges facing many data analysts is joining disparate data sets. Recently at DataDistillr, we assisted a prospective customer with an interesting problem which I thought I’d share. In this case, the customer had data from an internal database which had URLs in it, and was looking to create a combined report with some data from SalesForce. The only key that these data sets had in common was the domains in the URL and the domains in email addresses.
These kinds of problems are exactly the kinds of issues that we built DataDistillr for, so let’s take a look at how we might accomplish this. For this post, I generated some CSVs with customer data, one which had URLs and the other which had emails. Using DataDistillr, the process would be exactly the same whether the data was coming from a files, a SaaS platform or a database.
Googlesheets (GS) is one of those data sources that I think most data scientists use and probably dread a little. Using GS is easy enough, but what if a client gives you data in GS? Or worse, what if they have a lot of data in GS and other data that isn’t? Personally, whenever I’ve encountered data in GS, I’ve usually just downloaded it as a CSV and worked on it from there. This works fine, but if you have to do something that requires you to pull this data programmatically? This is where it gets a lot harder. This article will serve as both a rant and tutorial for anyone who is seeking to integrate GoogleSheets into their products.
I decided that it would be worthwhile to write a connector (plugin) for Apache Drill to enable Drill to read and write Google Sheets. After all, after Excel, they are probably one of the most common ways people store tabular data. We’ve really wanted to integrate GoogleSheets into DataDistillr as well, so this seemed like a worthy project. You can see this in action here:
So where to start?
Aha! You say… Google provides an API to access GS documents! So what’s the problem? The problem is that Google has designed what is quite possibly one of the worst SDKs I have ever seen. It is a real tour de force of terrible design, poor documentation, inconsistent naming conventions, and general WTF.
To say that this was an SDK designed by a committee is giving too much credit to committees. It’s more like a committee who spoke one language, hired a second committee which spoke another language to retain development teams which would never speak with each other to build out the API in fragments.
As you’ll see in a minute, the design decisions are horrible, but this goes far beyond bad design. The documentation, when it exists, is often sparse, incomplete, incoherent or just plain wrong. This really could be used as an exemplar of how not to design SDKs. I remarked to my colleague James who did the code review on the Drill side, that you can tell when I developed the various Drill components as the comments get snarkier and snarkier.
One of the biggest challenges in data science and analytics is… well… the data. I did a podcast and the interviewer (Lee Ngo) asked me a question about challenges in data science. We were talking and I told him that it reminded me a lot of a story I heard about immigrants to America in the early 20th century. They came here thinking the streets were paved with gold, but when they arrived, they discovered that not only were the streets not paved with gold, they were not paved at all, and they were expected to pave them. What does this have to do with data?
Well, it always surprises me when new data scientists or data analysts are surprised when they start a project and the data is rubbish. Especially when organizations are early in their data journey, it is very common to have data that is extremely difficult to work with. When this happens, you can either complain about it, as many data scientists are wont to do, or you can roll up your sleeves and start cleaning.
With that said, one of the things that always surprises me is how little data cleaning is often offered in most data tools, which in turn has spawned an entire industry of data cleaning or data quality tools which need to be bolted into your data stack. I’ve always felt this was silly and that this is a basic functionality that analytic tools should just have. So DataDistillr does! But I digress, let’s get back to the original topic of cleaning names.
It seems I always start my posts with “it’s been a while since I last posted…”. Well, it has. The truth is that during the month of April, I did something I hadn’t done in a while: took a vacation. That was nice, but then I got COVID (not fun), which everyone in my household got. Then I went to Singapore. More on that later. I’ve also been very heads down with some coding and technical stuff relating to security on our startup. I’ll tell you all about that in part 15. Anyway… I wanted to share a long overdue update.
A week ago, I posted a LinkedIn poll where I asked the question: “How many of you use Excel or GoogleSheets as a database?” In my extremely unscientific poll, about 45% of the responses said that they did. Indeed, this poll mirrors my experience in talking with customers in that despite massive corporate investments in platforms like Snowflake, Splunk, data lakes, delta lakes, lake houses, tons of work is done in Excel. The result is that for many organizations, a significant amount of their most valuable data isn’t in their data lake.
For the last few years, I’ve been involved with Splunk engineering. I found this to be somewhat ironic since I’ve haven’t used Splunk as a user for a really long time. I was never a fan of the Splunk query language (SPL) for a variety of reasons, the main one being that I didn’t want to spend the time to learn a proprietary language that is about as elegant as a 1974 Ford Pinto. I had worked on a few projects over the years that involved doing machine learning on data in Splunk. which presented a major challenge. While Splunk does have a machine learning toolkit (MLTK), which is basically a wrapper for scikit-learn, doing feature engineering in SPL is a nightmare.
So, how DO you do machine learning in Splunk?
You don’t.
No,Really… How do you do machine learning in Splunk?
Ok… People actually do machine learning in Splunk, but IMHO, this is not the best way to do it, for several reasons. Most of the ML work I’ve seen done in Splunk involves getting the data out of Splunk. With that being the case, the first thing I would recommend to anyone attempting to do ML in Splunk is to take a look at huntlib (https://github.com/target/huntlib) which is a python module to facilitate getting data out of Splunk. Huntlib makes this relatively easy and you can get your data from Splunk right into a Pandas DataFrame. But, you still have to know SPL or you do a basic SPL search and do all your data wrangling in Python. Could there be a better way?