The image above is a late 50’s MGA convertible. I picked this because I happen to think that this car is one of the most elegantly designed cars ever made. Certainly in the top 50. While we as people place a lot of emphasis on design when it comes to physical objects that we use, when it comes to software, a lot of our software’s design looks more like the car below: This vehicle looks like it was designed by a committee that couldn’t decide whether they were designing a door stop or a golf cart.
I’ve been doing a lot of thinking lately (for reasons that will become apparent in a few weeks) about the lack of good software engineering practices in the data science space. The more I think about it, the more I am shocked with the questionable design that exists in the data science ecosystem, particularly in Python. What’s even more impressive is that the python language is actually designed to promote good design, and the people building these modules are all great developers.
As an example of this, I recently read an article about coding without if statements and it made me cringe. Here is a quote:
When I teach beginners to program and present them with code challenges, one of my favorite follow-up challenges is: Now solve the same problem without using if-statements (or ternary operators, or switch statements).
You might ask why would that be helpful? Well, I think this challenge forces your brain to think differently and in some cases, the different solution might be better.
There is nothing wrong with using if-statements, but avoiding them can sometimes make the code a bit more readable to humans. This is definitely not a general rule as sometimes avoiding if-statements will make the code a lot less readable. You be the judge.
Well, I am going to be the judge and every example the author cited made the code more difficult to follow. The way I see it, hard to follow code means that you as the developer are more likely to introduce unintended bugs and errors. Since the code is difficult to follow, not only will you have more bugs, but these bugs will take you more time to find. Even worse, if you didn’t write this code and are asked to debug it!! AAAAHHHH!! I know if that were me, I wouldn’t even bother. I’d probably just rewrite it. The only exception would be if it was heavily commented.
Today marks about the 45th day I’ve been stuck in the house and it happens that my birthday was last week, so I’ve been doing a lot of reading and reflecting on things. The last few weeks have been really up and down. I’ve been doing a lot of puttering around the house and working on silly projects like replacing the headlight gaskets on my MGA, which also involved painting the headlight buckets, cutting off rusty screws and redoing wiring, but I digress. Despite being home all the time, I’m finding it very difficult to get any meaningful work done.
Before
After
On the up side, I’ll be doing some new online classes with O’Reilly starting around the end of May! The topics relate to coding practices and data visualization, so stay tuned!
As you are reading this, you are probably (like me) under quarantine or shelter in place due to the COVID-19 outbreak. As a data scientist who has been stuck in the house since 10 March, I wanted to take a look at the data and see what I could figure out. I’m not an epidemiologist and claim no expertise in health care, but I do know data science so please take what I am saying with a grain of salt.
Why is there no data?
My first observation is that very little data is actually being made publicly available. I am not sure why this is the case, but I spent a considerable amount of time digging through the WHO, CDC and other agencies’ websites and APIs and found little usable data. For example, the World Health Organization (WHO) posts daily situation reports with data, however the sitreps contain data, however the files are in PDF format. I attempted to extract these tables from the PDFs however this proved to be extremely difficult as the formatting was not consistent. It would be trivial to post this data in CSV, HDF5 or some other format that is conducive to data analysis, however the WHO did not choose to do that. I found generally the same situation at the other major health institutions such as the CDC.
Health related information in the United States is regulated by the Health Insurance Portability and Accountability Act (HIPAA), which imposes draconian fines and restrictions on private health information, so some of the secrecy may be due to this law.
There is a data format called HDF5 (Hierarchical Data Format) which is used extensively in scientific research. HDF5 is an interesting format in that it is like a file system within a file, and is extremely performant. However, the HDF5 format can be quite difficult to actually access the data that is encoded in HDF5 format. But, as the title suggests, this post will walk you through how to easily access and query HDF5 datasets using my favorite tool: Apache Drill.
As of version 1.18 Drill will natively support reading HDF5 files.
Let me start out by saying this is purely hypothetical as I’ve never been to a data science bootcamp, but I have taught them and have reviewed MANY curricula. I’ve also mentored a decent number of bootcamp graduates. In general, what I see is that bootcamps tend to place a lot of emphasis on machine learning but there’s a lot more to being a successful data scientist. The list below are five areas which I believe would benefit any aspiring data scientist.
SQL
Let’s start with an easy one. SQL. Despite all the trashing that it gets, SQL is an enormously useful language to know. Despite all the hype one hears about NoSQL and other non-relational datastores, SQL is still in widespread use and is not likely to go anywhere anytime soon. Let me tell you why you should learn SQL….
I ran into an issue whilst doing a machine learning project involving some categorical data and thought I would write a brief tutorial about what I learned. I was working on a model which had a considerable amount of categorical data and I ran into several issues which can briefly be summarized as:
Categories that were present in the training set were not always present in the testing data
Categories that were present in the testing set were not always present in the training data
Categories from “real world” (IE non testing or training) data were not present in the training or testing data
Handling Categorial Data: A brief tutorial
In Python, one of the unfortunate things about the scikit-learn/pandas modules is that they don’t really deal with categorical data very well. In the last few years, the Pandas community has introduced a “categorical” datatype. Unfortunately, this datatype does not carry over to scikit-learn, so if you have categorical data, you still have to encode it. Now there are tons of tutorials on the interweb about how to do this, so in the interests of time, I’ll show you the main methods:
GetDummies in Pandas
The most conventional approach and perhaps the easiest is pandas get_dummies() function which takes the input of a given column or columns and returns dummy columns for each category value. (Full docs here). Thus you can do the following:
df = pd.get_dummies(df)
data
0
a
1
b
2
c
3
a
4
a
5
a
6
c
7
c
8
c
data_a
data_b
data_c
0
1
0
0
1
0
1
0
2
0
0
1
3
1
0
0
4
1
0
0
5
1
0
0
6
0
0
1
7
0
0
1
8
0
0
1
Which turns the table on the left into the table on the right.
As you can see, each category is encoded into a separate column with the column name followed by an underscore and the category variable. If the data is a member of that category, the column has a value of 1 otherwise the value is zero, hence the name One Hot Encoding.
In general this works, but the pandas method has the problem of not working as a part of a Scikit-Learn pipeline. As such scikit-learn also has a OneHotEncoder which you can use to do basically the same thing.
Personally, I find scikit’s OneHotEncoder to be a bit more difficult to use, so I didn’t really use it much, however, in my recent project I realized that I actually had to for a reason I’ll get to in a bit.
Scikit Learn’s OneHotEncoder
Scikit-Learn has the OneHotEncoder() (Docs here) which does more or less the same thing as the pandas version. It does have several limitations, and quirks. The first being that the data types of your categories must be the same. IE if you have ints and strings, no go.. Secondly, scikit’s encoder returns either a numpy array or a sparse matrix as a result. Personally, this was annoying for me as I wanted to see what categories were useful as features, and in order to do so, you have to reconstruct a dataframe, which is a headache. In general, the code follows scikit’s general pattern of fit(), transform(). Here is example code of how to use scikit’s one hot encoder:
from sklearn.preprocessing import OneHotEncoder
encoder = OneHotEncoder(handle_unknown='ignore')
encoded_data = encoder.fit_transform(df[<category_columns>])
There are two advantages that I see that scikit’s method has over pandas. The first is that when you fit the scikit encoder, it now “remembers” what categories it has seen, and you can set it to ignore unknown categories. Whereas pandas does not have any recall and will just automatically convert all columns to dummy variables. The second is that you could include the OneHotEncoder in a pipeline which seemed like that would be advantageous as well. However, these advantages did not outweigh the difficulty of getting the data back into a dataframe with column labels. Also, I kept getting errors relating to datatypes and got really frustrated.
The original problem I was having was that you couldn’t guarantee that all categories would be present in both the training and testing set, so the solution I came up with was to write a function that switched the category value to “OTHER” if the category was not one of the top few. But I didn’t like this approach because it required me to maintain a list of categories and what happened if that list changed over time? Surely there’s a better way…
Feature-Engine: A Better Solution
So what if I told you there was a way to encode categorical data such that you could:
Handle missing categories in either testing, training or real world data
Export the data to a DataFrame for easy analysis of the newly created features
Automatically aggregate categories with few values into an “other” category
Well you can’t so get over it. Ok, just kidding. I wouldn’t write a whole blog post to have it end like that… or would I? As it turns out, I stumbled upon a really useful module called feature-engine which contains some extremely useful tools for feature engineering that frankly should be included in Scikit-Learn. This module contains a collection of really useful stuff, but I’m just going to focus on the OneHotCategoryEncoder. (Docs here)
Let’s say you wanted to encode the data above, using the OneHotCategoryEncoder() you could create an encoder object as shown below:
from feature_engine import categorical_encoders as ce
import pandas as pd

# set up the encoder
encoder = ce.OneHotCategoricalEncoder(
    top_categories=3,
    drop_last=False)

# fit the encoder
encoder.fit(df)
encoder.transform(df)
Now, once we have the encoder object, we can encode our data using the fit()/transform() or the fit_transform() methods as shown above. Our toy data set above only has 3 categories, but what if it had 300? Feature-Engine provides an option in the constructor, top_categories, which has the effect of collapsing the into a more manageable number. For example, you could set the top_categories to 10 and that would get you the 10 most frequently occurring category columns and all others would be collapsed into an “other” column. That’s a nice feature! Well done!
There’s more. In our previous example, we had three categories when we fit the data, ‘A’, ‘B’ and ‘C’. So what happens if we have another category in the data that did not appear in the training data? Good question, and one that is not explicitly addressed in the documentation. So I tried this out and if you have the top_categories set, the encoder will ignore the unknown categories. This is debatable as to whether this is good design or not, but what it does mean is that it will work much better in real world applications.
Since the OneHotCategoricalEncoder uses the fit()/fit_transform()/transform() from scikit-learn, it can be used in a Pipeline object. Finally, and perhaps most important to me, is that the OneHotCategoricalEncoder returns a pandas DataFrame rather than numpy arrays or other sparse matrices. The reason this mattered to me was that I wanted to see which categorical columns actually are adding value to the model and which are not. Doing this from a numpy array without column references is exceedingly difficult.
TL;DR
In conclusion, both scikit-learn and Pandas traditional ways of encoding categorical variables have significant disadvantages, so if you have categorical data in your model, I would strongly recommend taking a look at Feature-Engine’s OneHotCategoricalEncoder.
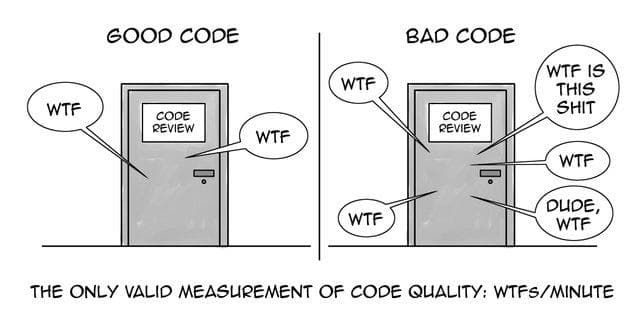
In the early days of data science, many data scientists came with a math background and as a result I think the field took on some bad practices, at least from a computer science perspective. In this post, I’m going to introduce ten coding practices that will help you write better code.
You might say that better is a subjective term, however, I believe that there are concrete measurements to define good vs. bad code.
Good code is easy to understand and thus will take less time to write and most importantly debug
Good code is easy to maintain by other people besides the author
Writing code well will avoid hidden intent errors–ie errors that exist such that your code executes and does what it’s supposed to do most of the time. Intent errors are the worst because your code will appear to work, but all of a sudden, there will be some edge case or something you didn’t think about and now your code breaks. These are the most insidious errors.
Good code is efficient.
Ultimately, taking on good coding practices will result in fewer errors, which directly translates to more work (value) being delivered and less effort being spent on fixing and maintaining code. Apparently this is a bigger issue than I realized. When I was writing this article, this other article got posted to my Twitter feed: https://insidebigdata.com/2019/08/13/help-my-data-scientists-cant-write-production-code/. I’ll try not to duplicate the points this author made, but in general, the biggest difference that I see between code most data scientists write and production code is that data scientists tend not to think about reusability.
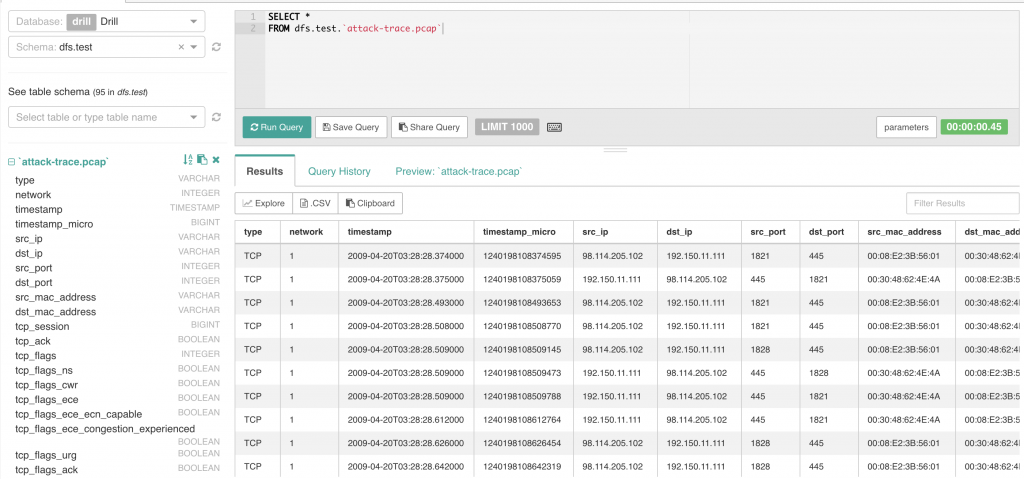
I have been working on using Apache Drill for security purposes and I wanted to demonstrate how you can use Drill in a real security challenge. I found this contest which included a PCAP file of an actual attack, as well as a series of questions you would want to answer in order to the analysis. (https://www.honeynet.org/node/504)
My thought here is that Drill’s advanced ETL capabilities are not terribly useful if you can’t use Drill to do basic stuff that tools like Wireshark can do already, so I wanted to see if it would work in real life. This example was good because I also had “the answers” so I could see how Drill stacks up to the contest winners.
First, I had to see if Drill could actually read the PCAP. The PCAP reader can be a bit wonky, but fortunately, Drill read it without issues! (Whew!). For these examples, I will be using Drill and Superset.
Part one will contain a demonstration of how to use Drill to answer the questions in the first part of the challenge.
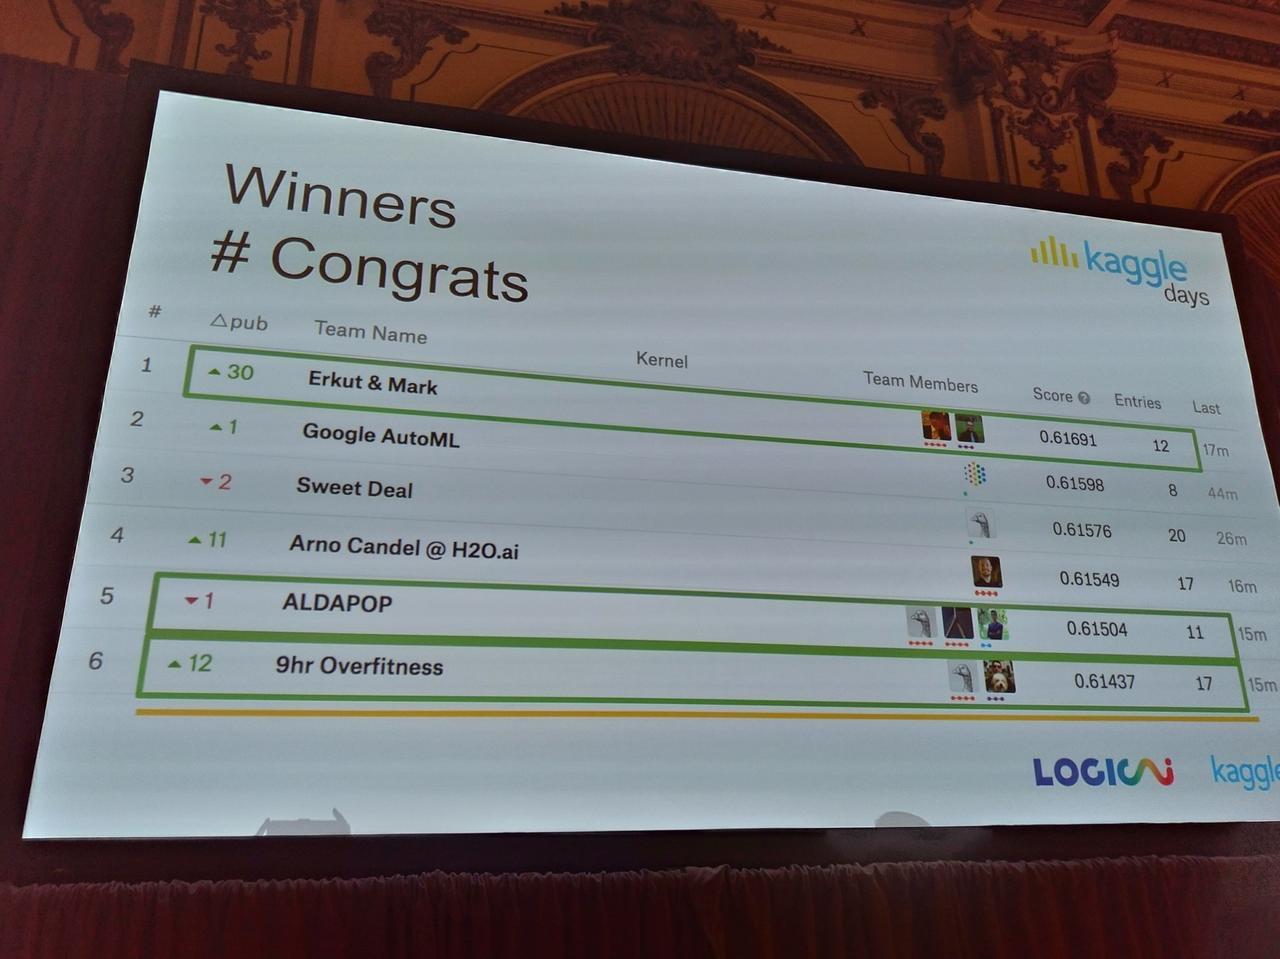
I saw this image on LinkedIn a few days ago and realized that it is proof of the future of data science. The image is of the leaderboard from a Kaggle competition, which isn’t particularly remarkable, but what is remarkable is the competitor in 2nd place: Google AutoML. Not only did AutoML come in 2nd, but it did so in fewer entries and the score was 0.00093 off of first place.
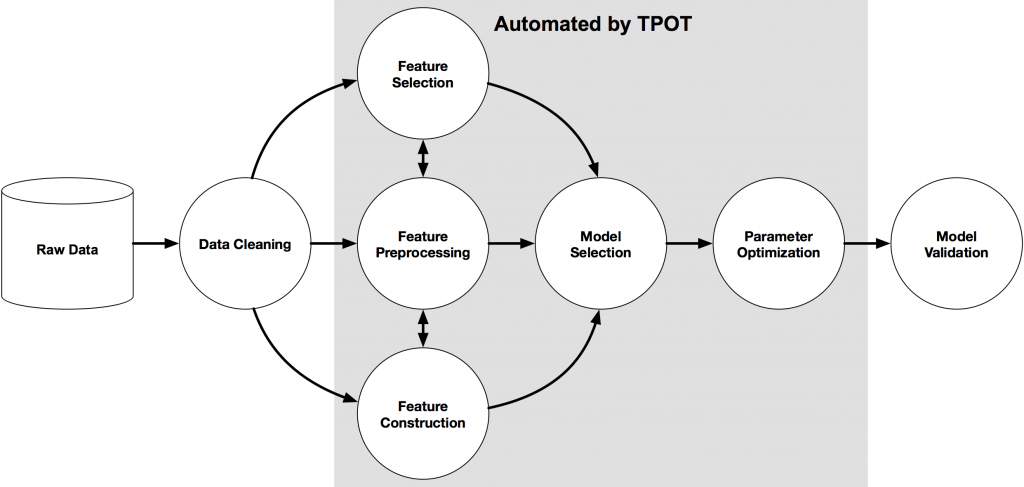
You might be thinking, “Well that’s Google, and they have the best stuff. Technology like that will not be available to the masses anytime soon, and if it is, it will require massive clusters.” Au contraire mon frère. There are a slew of new Python modules which automate various phases of the machine learning process. My personal favorite of which is called TPOT. TPOT is a Python module which automates the entire machine learning process, and generates python code for your entire pipeline.
I did a little experiment with TPOT and was able to build a model with data from Kaggle that scored in the top 10 for a simple exercise.
At some point, Google will likely make their AutoML available to the public if it isn’t already, and data scientists will have to prove that their value over automated machine learning tools.
So What?
The significance of this is enormous. Since the coining of the term data science, many people have focused very heavily on the math and machine learning aspects of data science. These aspects are certainly important, but these steps can be automated, as you can see, with ever improving performance. What this means in the long run is that as available computing power increases and these tools get better and faster, the understanding of the inner workings of the algorithms will become less and less important. (This is not true if you are working at a really cutting edge company that is developing new algorithms, or doing academic research.)
Therefore, if you are a data scientist or an aspiring data scientist, should you quit now? Hardly. Automated ML is really exciting because it will enable you to focus on the things that computers can’t do, and likely won’t ever be able to do, which are: conceiving and defining data problems, communicating the results to stakeholders, as well as the data cleaning/feature engineering steps. Automated machine learning will enable or force data scientists to focus on tasks that truly require human thought and using data science to add value to their organizations.
Happy New Year everyone! I’ve been taking a bit of a blog break after completing Learning Apache Drill, teaching a few classes, and some personal travel but I’m back now and have a lot planned for 2019! One of my long standing projects is to get Apache Drill to work with various open source visualization and data flow tools. I attended the Strata conference in San Jose in 2016 where I attended Maxime Beauchemin’s talk (slides available here) where he presented the tool then known as Caravel and I was impressed, really really impressed. I knew that my mission after the conference would be to get this tool to work with Drill. A little over two years later, I can finally declare victory. Caravel went through a lot of evolution. It is now an Apache Incubating project and the name has changed to Apache (Incubating) Superset.
UPDATE: The changes to Superset have been merged, so you can just install Superset as described on their website.